A history
of political conflict
Elections and social inequalities in France, 1789-2022
See
all data from the book
Select
an indicator
Selectan indicator
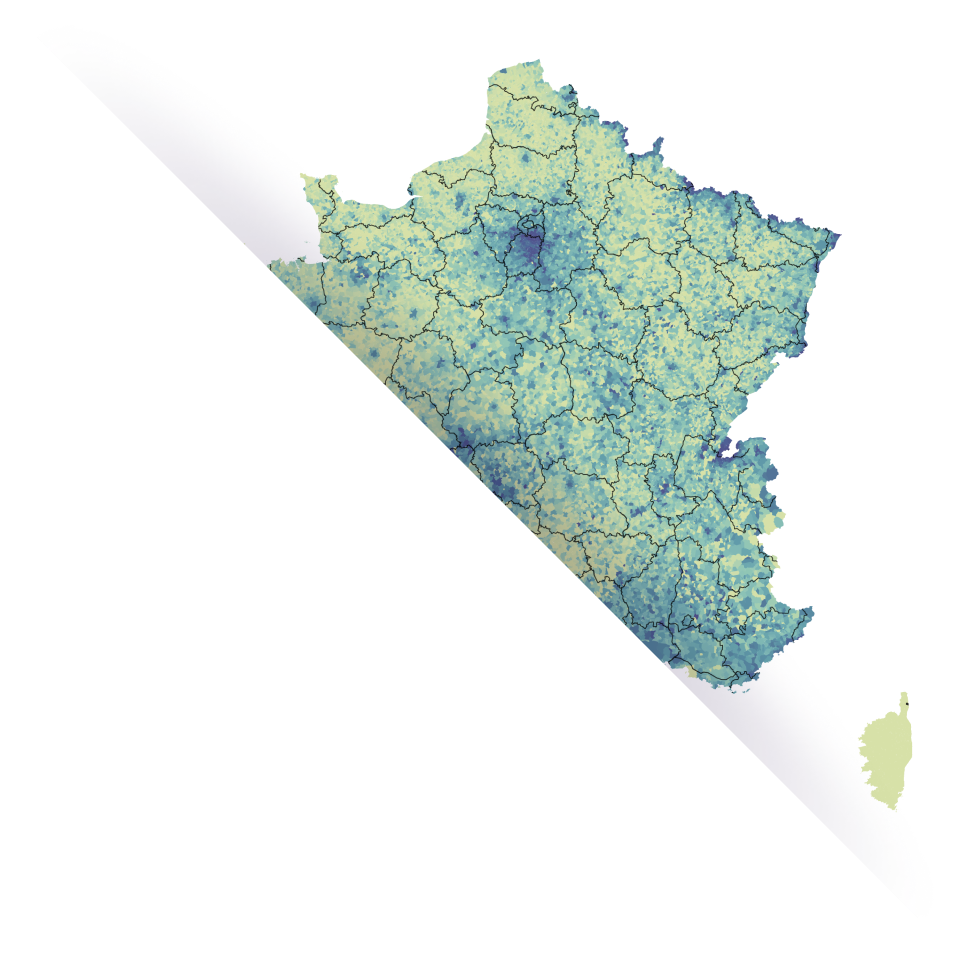
MAPPING
How have votes and wealth been distributed in France since 1789?
Select the elections (legislative, presidential, referenda) or socioeconomic characteristics (income, real estate capital, etc.) you wish to map, then zoom in on the area of your choice.
Or see an example
1936 legislative elections: Votes for the PCF
Choose
a municipality
PORTRAIT
How has your municipality voted over the past two centuries and where does it stand in terms of wealth distribution?
With just one click, see how your municipality ranks compared to the national average and how it has evolved over time, for all elections and socioeconomic characteristics.
Or see an example
7th arrondissement of Paris
Select
one or more indicators
Selectone or more indicators
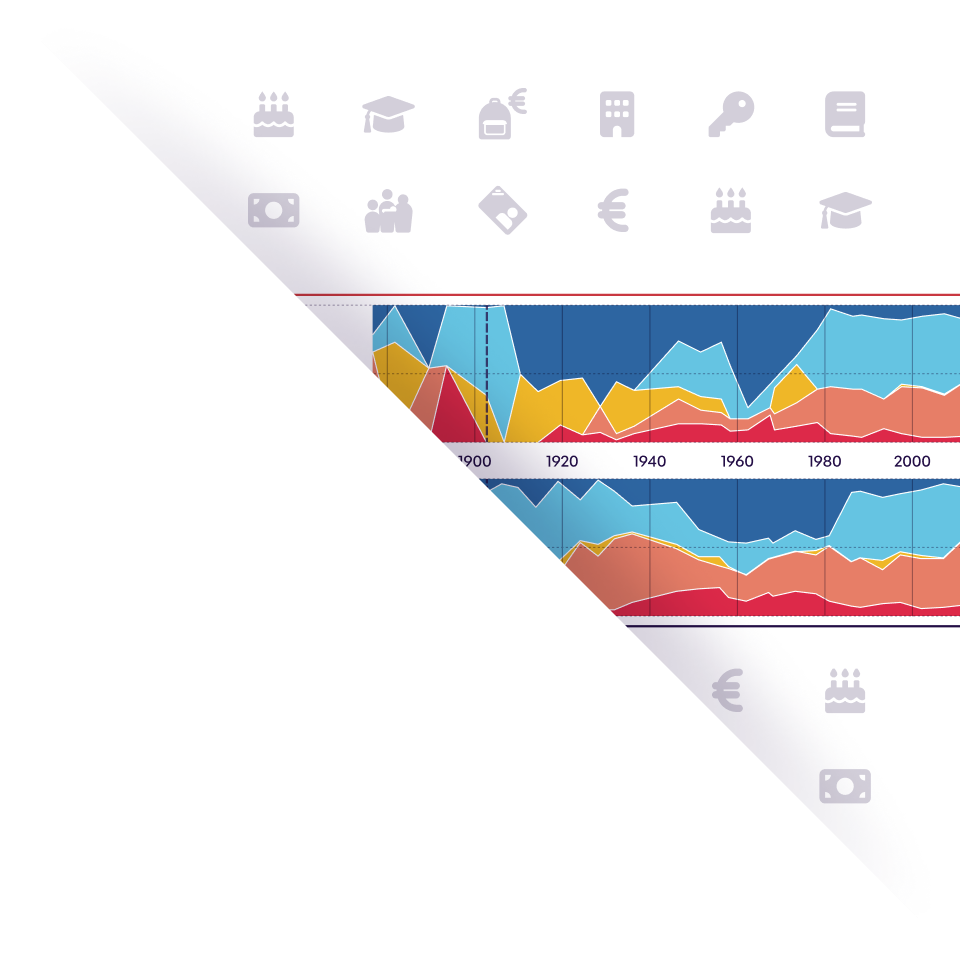
CONFLICT
Who has the most popular vote and the most bourgeois vote?
For all elections and political trends, find out in just one click how the score obtained varies with the wealth of the municipality.
Or see an example
1981 presidential elections: second round Giscard Mitterrand
Explore
the scope of our database
v1.1.5 - 2/9/2025 13:12